
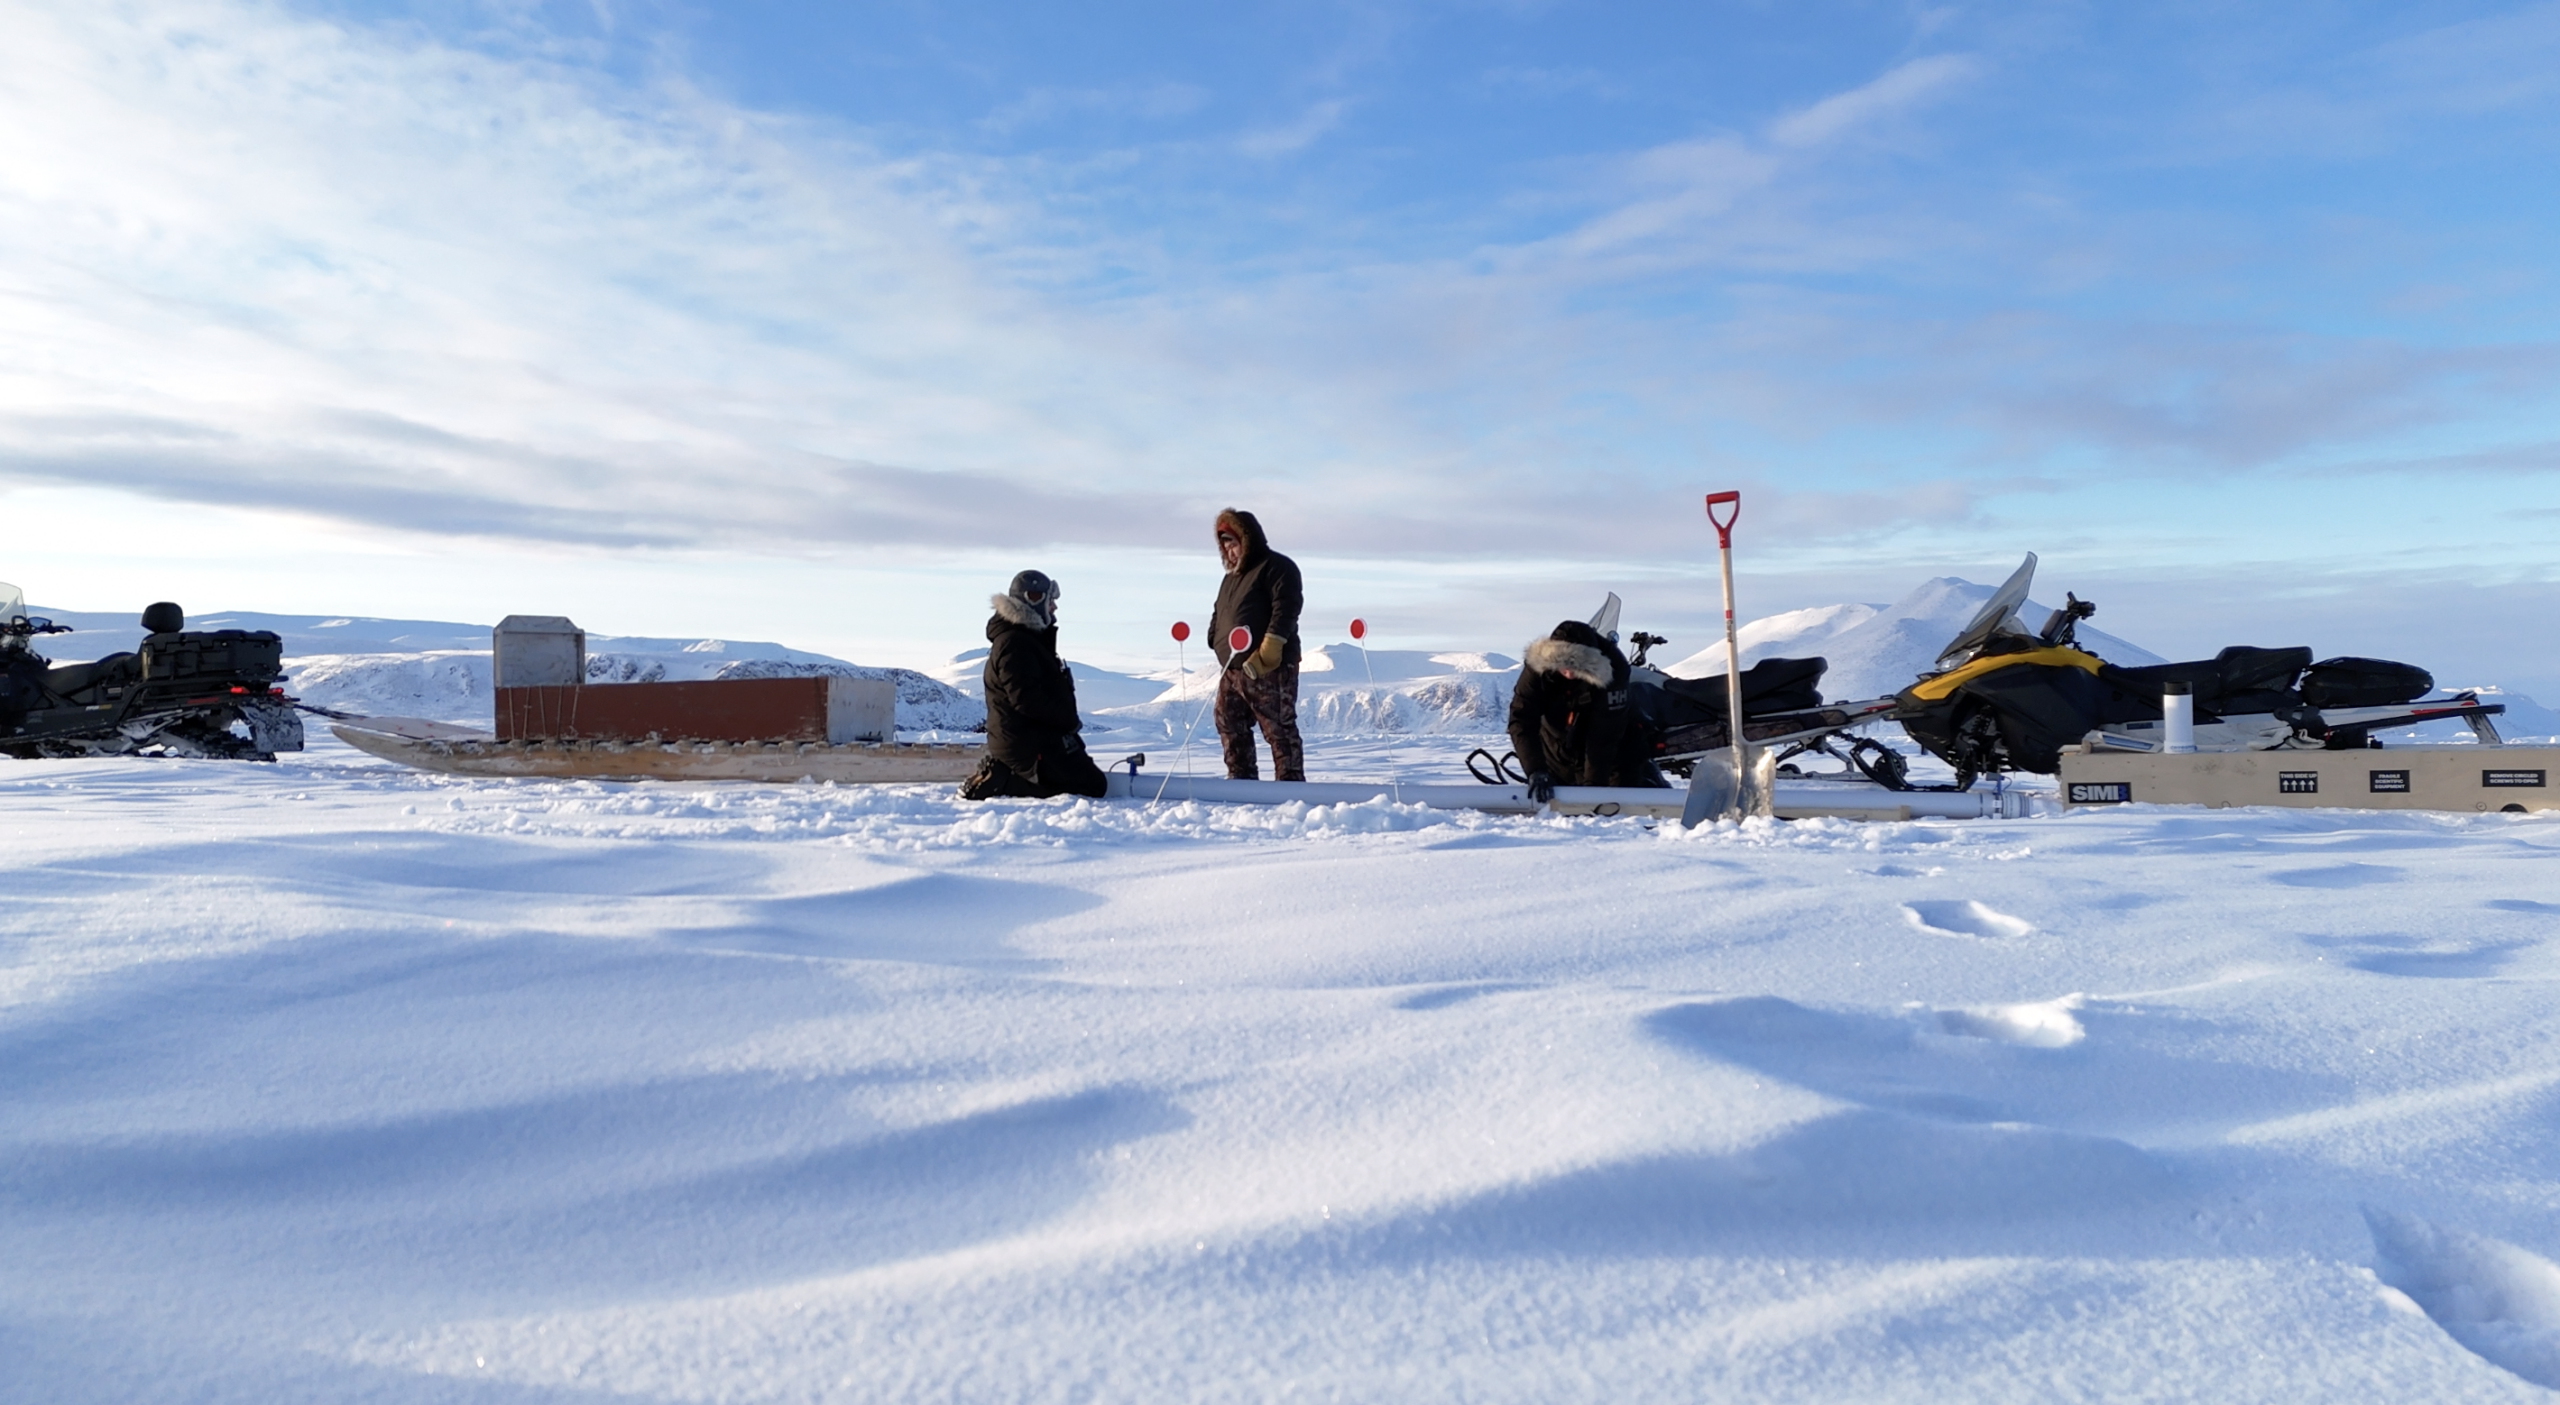

Wytse Petrie, data analyst at Arctic Reflections, was part of the crew for the third field test in Qikiqtarjuaq. Since returning from the field, he has been transforming the measurements we collected in Qikiqtarjuaq and remotely, into information we can analyse and share. In this article, Wytse writes about the journey the data makes from the Arctic to our screens.
While fieldwork is the more tangible and visible part of our research, it is only the first stage. A large part of our research begins after the field test, with the data collected during our measurement campaigns. Everything we do relies on this data, which starts its life as a measurement.
Three vantage points
To ensure our data is accurate, we collect measurements in three different ways. The most direct method is by hand, in the field. Good examples of this are the ice cores drawn from both the thickened and non-thickened ice, which are later analysed in a lab for thickness, salinity, temperature, chlorophyll content and density.
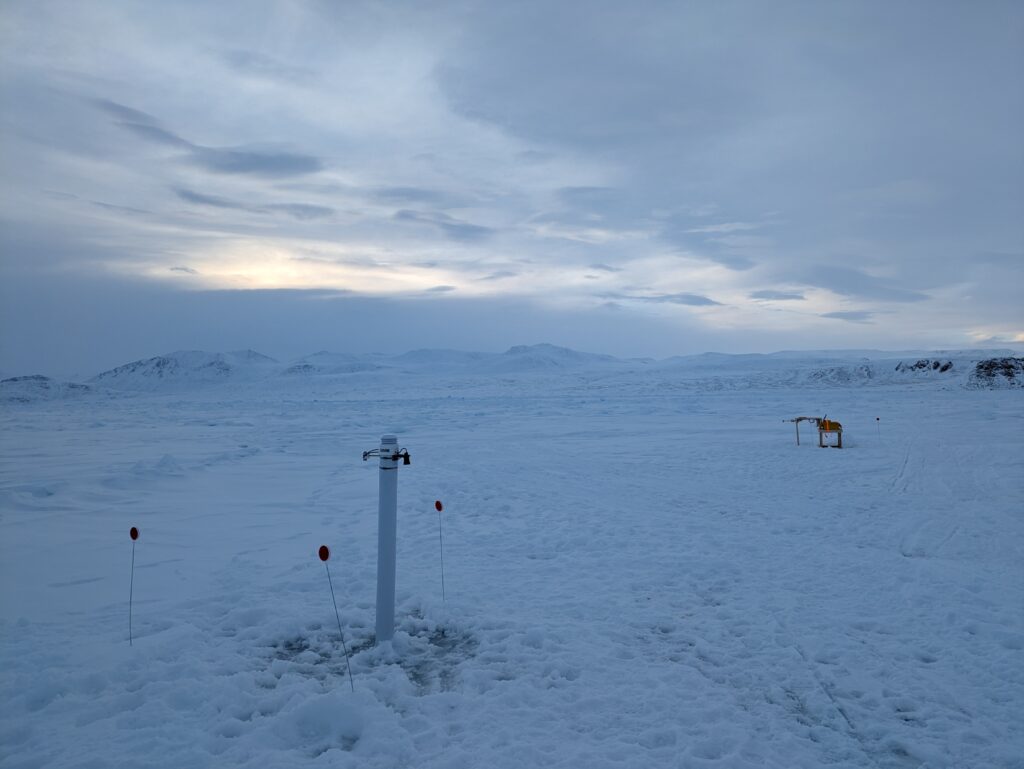
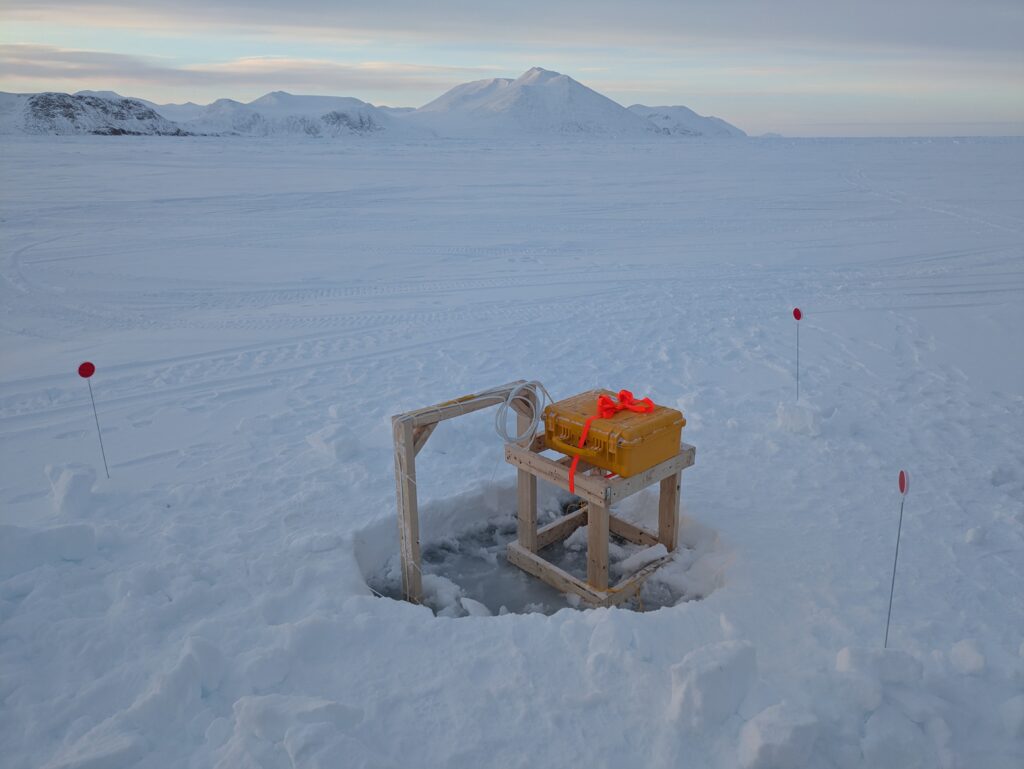
The second method relies on instruments we have installed in the ice, which record measurements at regular intervals. The buoys, for instance, record temperature from the top of the ice to the bottom, every four hours. They also carry radiation sensors that track how much sunlight reaches the surface, and how much of it is reflected back. From this, we can calculate the albedo of both the thickened and non-thickened ice – one of the key indicators of whether thickening the ice is indeed having a cooling effect.
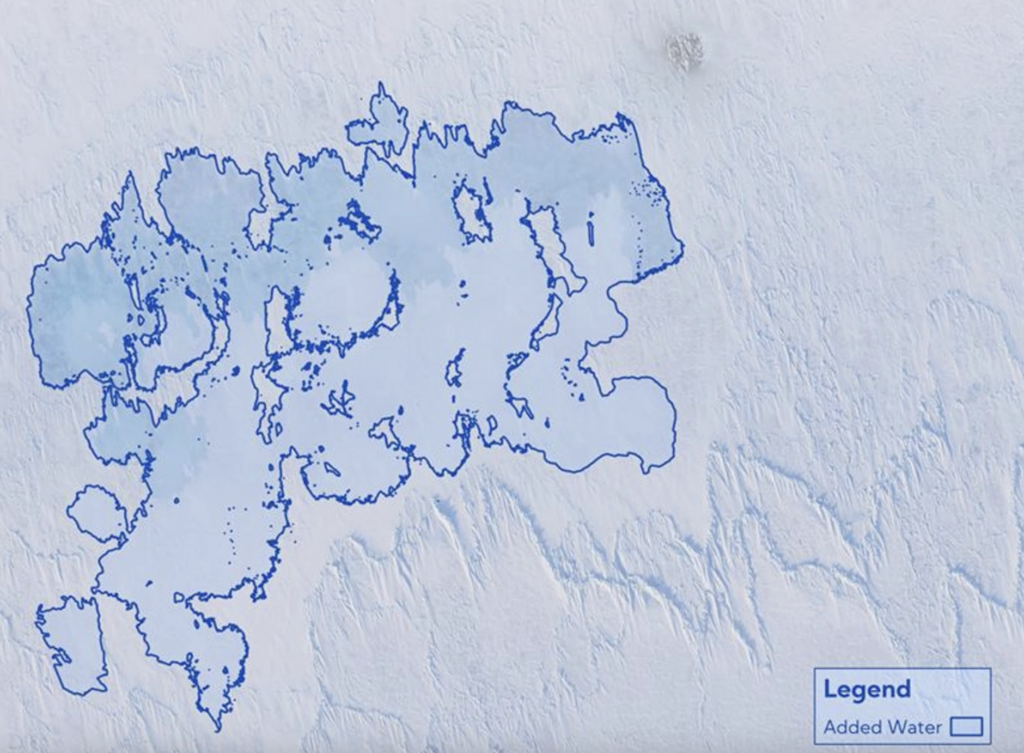
Lastly, there is the data we receive from above the site. During our measurement campaigns, we fly drones in grid patterns across the site to record the flooded water on the ice. The drones also allow us to document what is otherwise not visible: subtle differences in surface temperature, texture, and reflectivity. Further up, satellites give us a broader view of how the ice is developing across a much larger area over a longer timeframe. Each one of these sources captures a different aspect of the site, and together they form a comprehensive picture that no single method could provide on its own. For instance, the drone and satellite data helped us map the surface area of the ice we thickened, so we could determine that we thickened 17 hectares in our last field test.
Pieces of a puzzle
But each source delivers raw numbers – reams and reams of them, which need to be painstakingly cleaned and structured before they can be analysed. Once this is done, the analysis can begin: deriving ice thickness and growth rates from temperature profiles; mapping reflectivity and computing albedo from radiation records; and constructing salinity profiles.
Take ice thickness, for example – a buoy frozen into the ice carries a string of sensors at fixed depths, each sensor reports a temperature every four hours. Read individually, the numbers say very little, but plotted together as a profile, they tell a fascinating story about how air, ice and seawater conduct heat differently, with the boundaries between them appearing as distinct changes in the temperature gradient. Tracking these readings over weeks, allows us to witness how the ice is thickening or thinning, giving us a clear record of how the ice behaves.
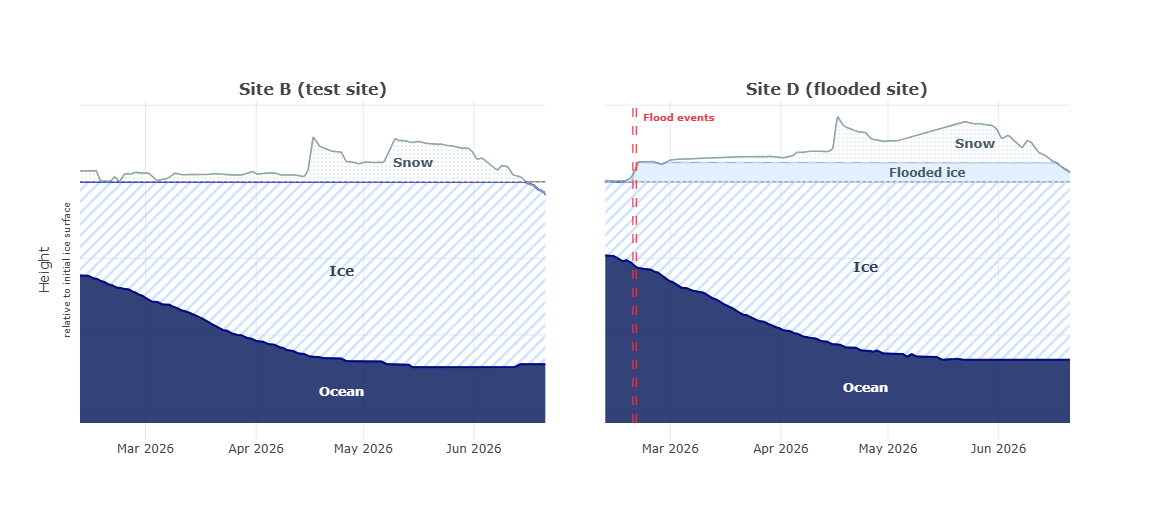
A live view of the field
Finally, the structured data becomes information about how the ice responds to the flooding over time, and the story the ice is telling us from afar begins to emerge. Over the last few months, we’ve been listening to that story and documenting it on a dashboard. This dashboard gives the team a near real-time view of what is happening on the ice, drawing separate streams of data into a coherent picture so we can see at a glance how the ice is developing across the different field sites.
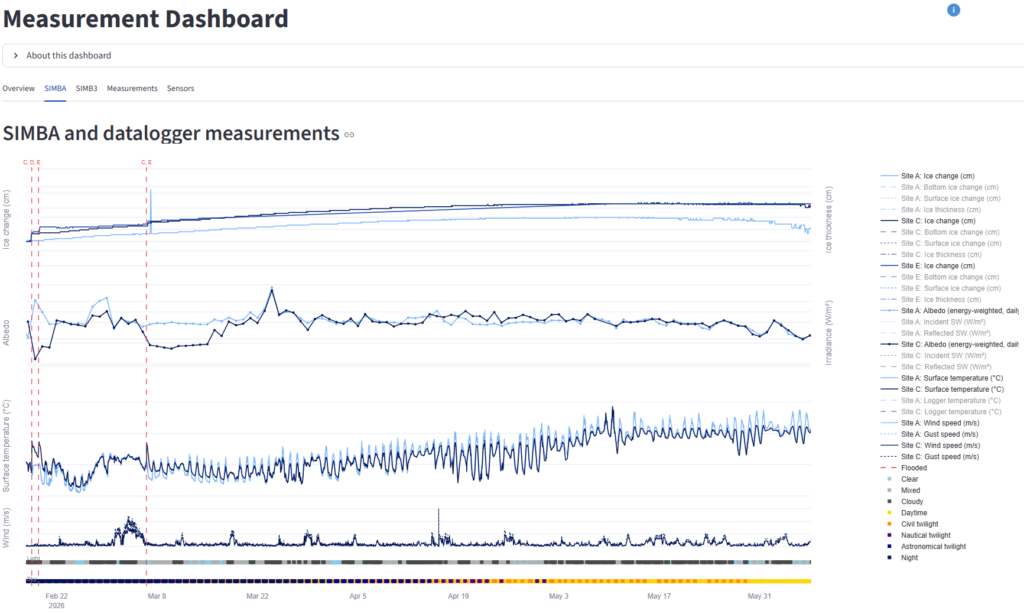
It effectively closes the gap between the office and the field. The sensors keep measuring hour after hour, unperturbed by freezing polar nights and Arctic storms. This steady input plays a key role in allowing us to turn a promising idea into real, actionable knowledge, and Arctic Reflections is committed to this process, from the first reading to a concrete result.